
RolePrincipal Product Designer
Key ProjectsSummaryAttentive is an AI-powered marketing platform innovating how brands build direct-to-consumer relationships through personalized messaging.
Reporting plays a critical role in helping customers measure program performance and understand the business value generated by Attentive’s suite of products.
Within the Empowering Insights & Reporting pillar, I served as lead designer on the Business Intelligence Engineering – Reporting team.
I owned end-to-end design delivery across multiple multi-quarter initiatives.
I partnered closely with product managers, engineers, research and data teams to translate complex requirements into scalable, user-centered reporting experiences.
My work spanned concept development, user research, prototyping, validation, and successful general release.
I set up the platform-wide reporting design strategy.
I led delightful and informative future product ideation workshops with my Product and Engineering counterparts that doubled as a means to educate them on how designers think, feel, and work with their tools, skills, and ethics within the product design process.
Analytics Dashboard
January 2025 - Present day
Initiative: Empowering Insights & Reporting (EIR)
OverviewAttentive’s Analytics Dashboard, a core reporting surface, had not been updated since late 2022. As a result, it no longer reflected evolving user needs or supported the growing complexity of Attentive’s multi-channel marketing ecosystem.
Users lacked quick access to actionable insights, relevant metrics, and visual clarity, leading to reduced engagement and slower decision-making.
ProcessAs design lead, I collaborated with Product, Engineering, Customer Success, and Voice of the Customer teams to reimagine the Analytics Dashboard.
Leveraging extensive user research on reporting and analytics workflows, I defined a new information architecture and visual system focused on clarity and usability.
Key elements of this overhauled design included:
Expanding key metrics coverage across all marketing channels
Introducing new data visualizations to simplify complex performance insights
Redesigning layout and hierarchy for intuitive navigation and faster comprehension
Partnering with Engineering to QA each development phase and resolve usability issues before beta launch
Co-facilitating beta user testing sessions and incorporating real-time feedback into design improvements
Collaborating with Technical Writing and Customer Education in producing updated help articles and in-app user guides with Pendo.
Impact5× increase in user engagement with the Analytics Dashboard post-launch.
100% positive satisfaction among beta participants, with all test users rating the new dashboard at the highest satisfaction level.
Release of this new dashboard directly upshifted customer sentiments in our quarterly Reporting CSAT survey. Our NPS score increased by 8 points from the previous quarter.
LearningsThis project truly tested and improved everything I had learned so far from being a product designer for useful and engaging reporting surfaces. I deepened my knowledge of data visualizations, reporting design best practices, multi-state layouts, among others.
In Figma, I learned how critical Variables implementation was to ensuring rapid prototyping of multiple modes of both user data, channel views, and responsive states.
This project also set the foundation for my future vision of bringing AI-driven enhancements that leverage LLMs to deliver predictive and automated insights for users’ reporting needs.

Reporting Platform Design Guidelines & CRAB Governance Council
Dec 2024 - Present day
Initiative: Empowering Insights & Reporting (EIR)
OverviewAs Attentive restructured its Engineering, Product, and Design organizations into autonomous pillars, the Empowering Insights & Reporting (EIR) pillar was created to establish scalable, self-service reporting guidelines across teams.
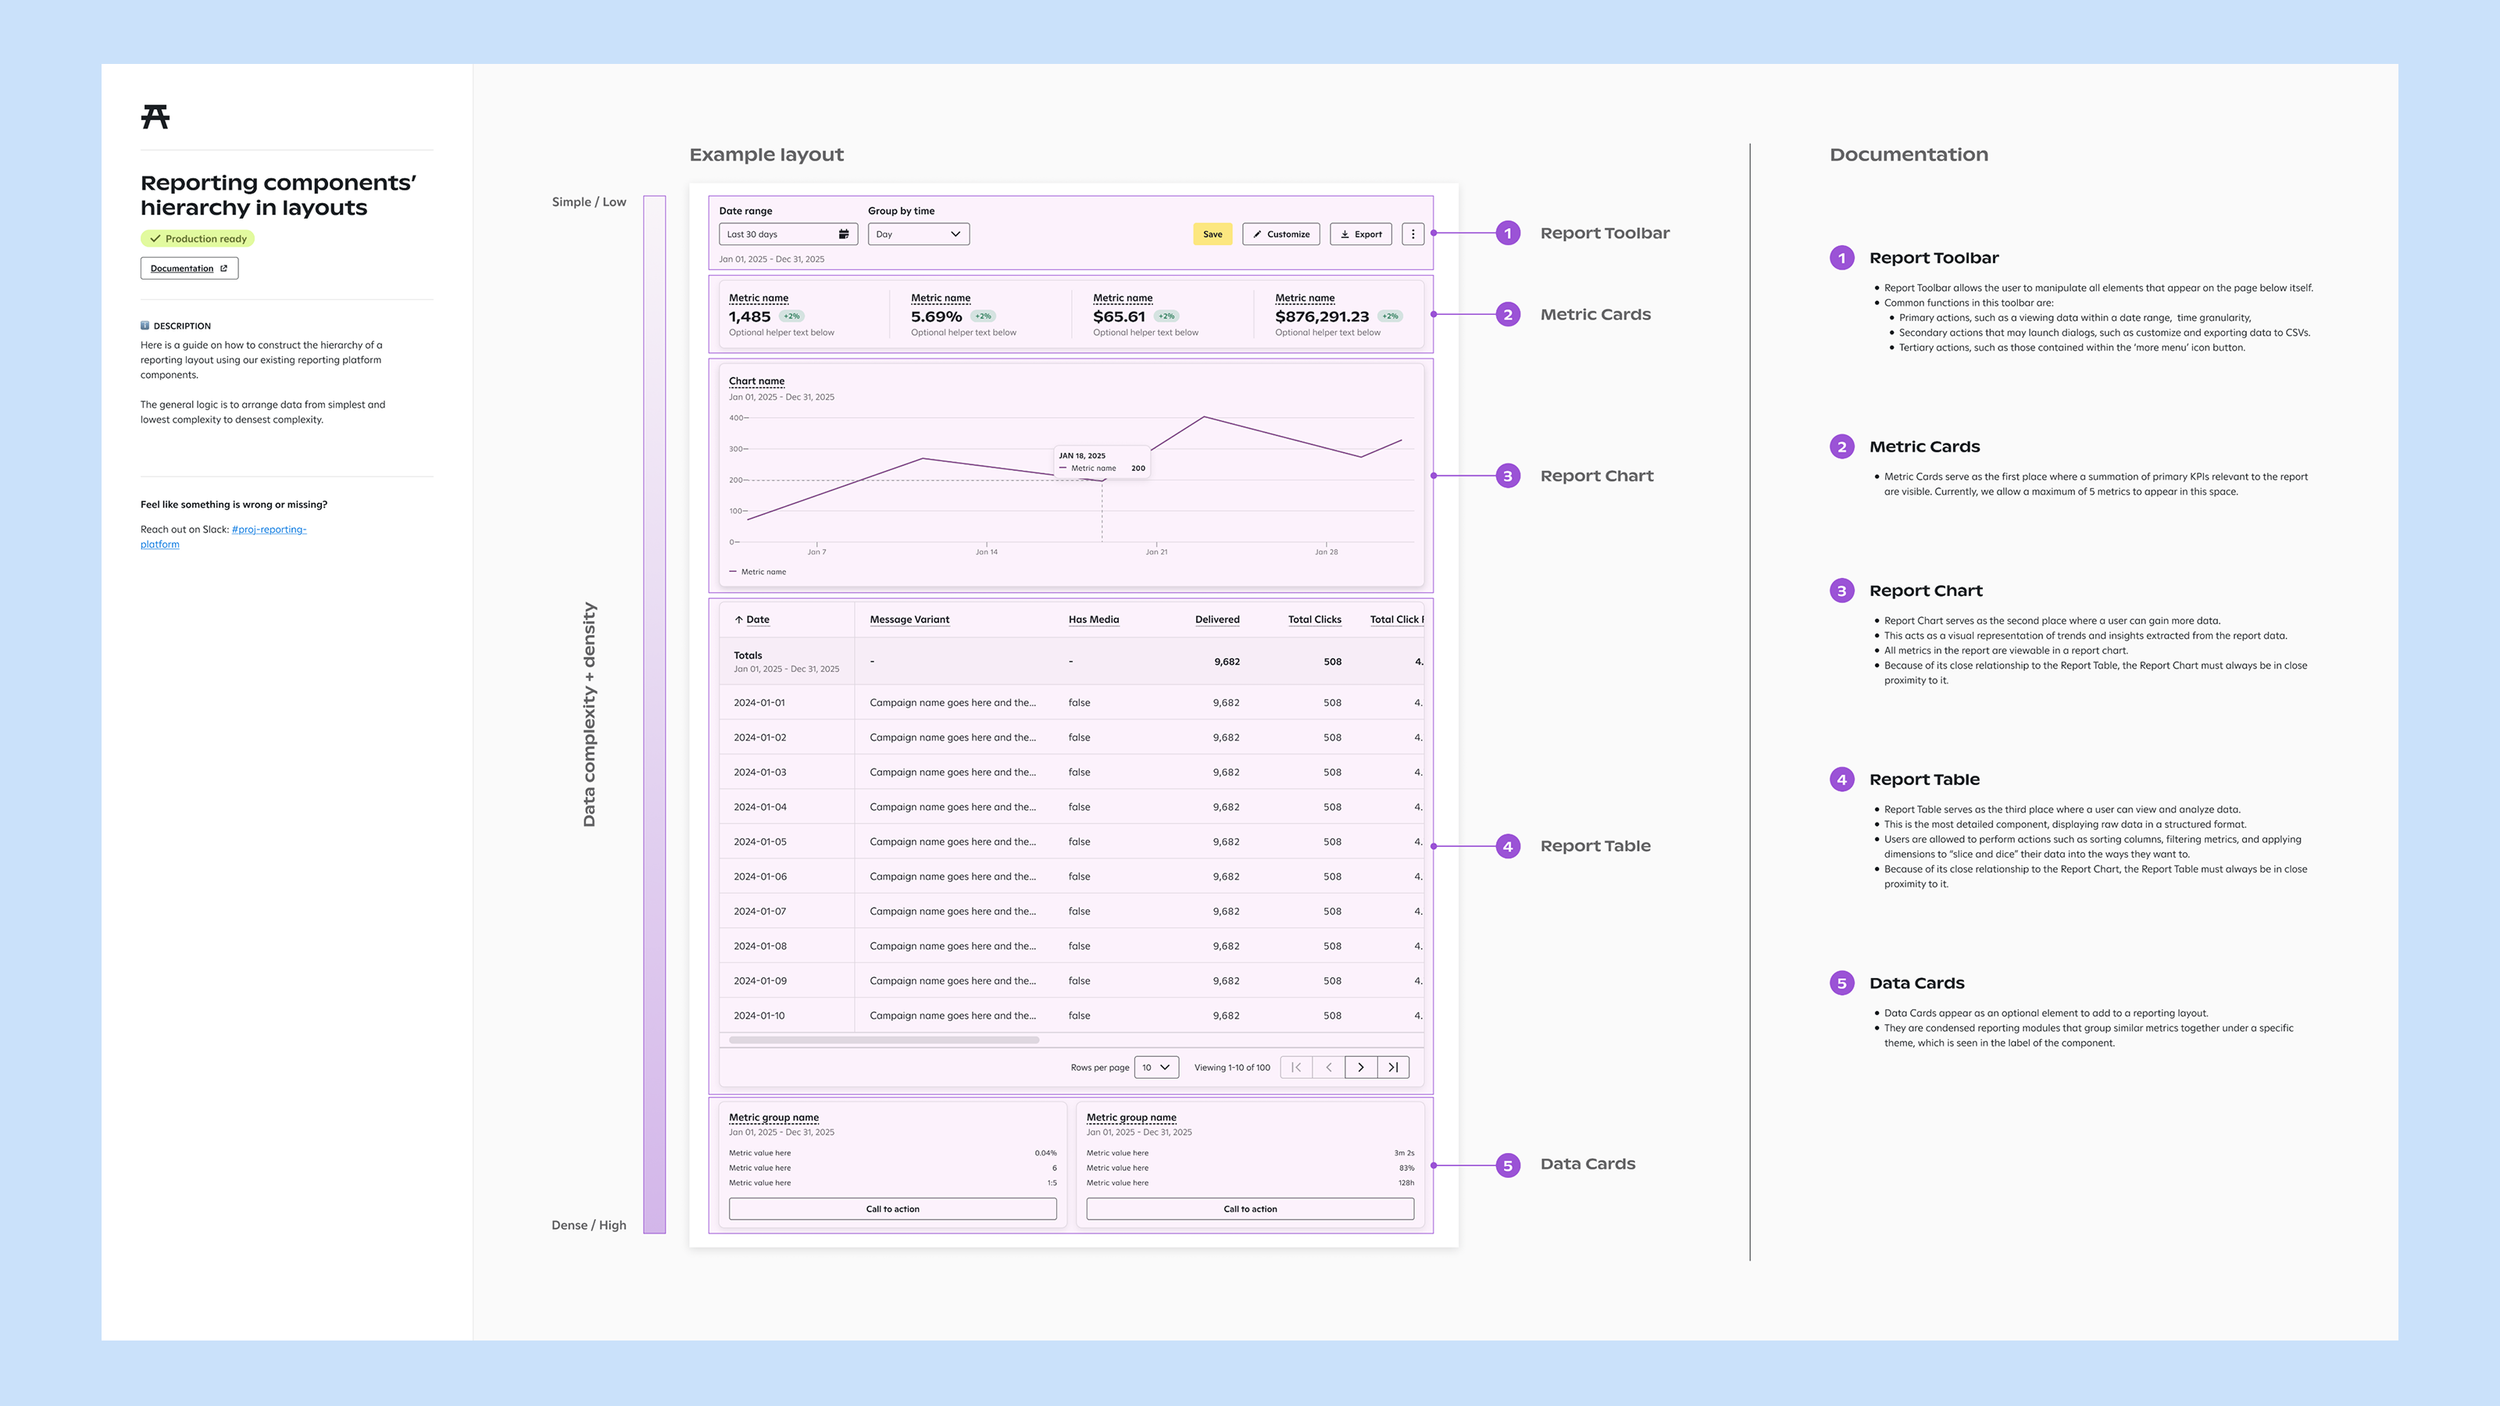
ProcessPartnering closely with Engineering and Product, I led the design documentation effort to codify reporting best practices into a single, accessible resource for both technical and non-technical audiences. This unified guide defined reporting principles, component usage standards, and, most importantly, accessibility considerations.
I co-founded a weekly governance council called CRAB (Client Reporting Advisory Board), where teams presented in-progress work that touches on reporting for feedback and alignment with EIR standards.
Highlights include:
I created an internal tool called the “Data Visualization Decision Maker 3000” to help teams identify which data visualizations are best suited for their reporting needs.
Working with my engineering counterparts on rigorous testing of reusable reporting components built from the nivo.rocks library.
I also contributed to building team identity and culture by designing the CRAB logo, to better align with our pillar’s pirate-themed mascot, Captain Byte.
ImpactEnabled faster development cycles and reduced dependency on the EIR team for routine reporting questions or handoffs
Created a centralized reporting design and development guide adopted across multiple teams, improving implementation speed and reducing design debt.
Oversaw the design and deployment of multiple key reporting updates across the Attentive platform following the adoption of the new framework.
LearningsGuidelines are meant to balance the needs of clarity and flexibility. I learned to keep documentation loose but structured enough for teams to help them evolve as our product becomes more complex.
Creating delightful cultural touch-points like the CRAB name and crustacean mascot showed me how easy it is to strengthen a remote team’s collective buy-in and engagement for our work.

Segment Reporting
March 2024 - Present day
Initiative: Empowering Insights & Reporting (EIR)
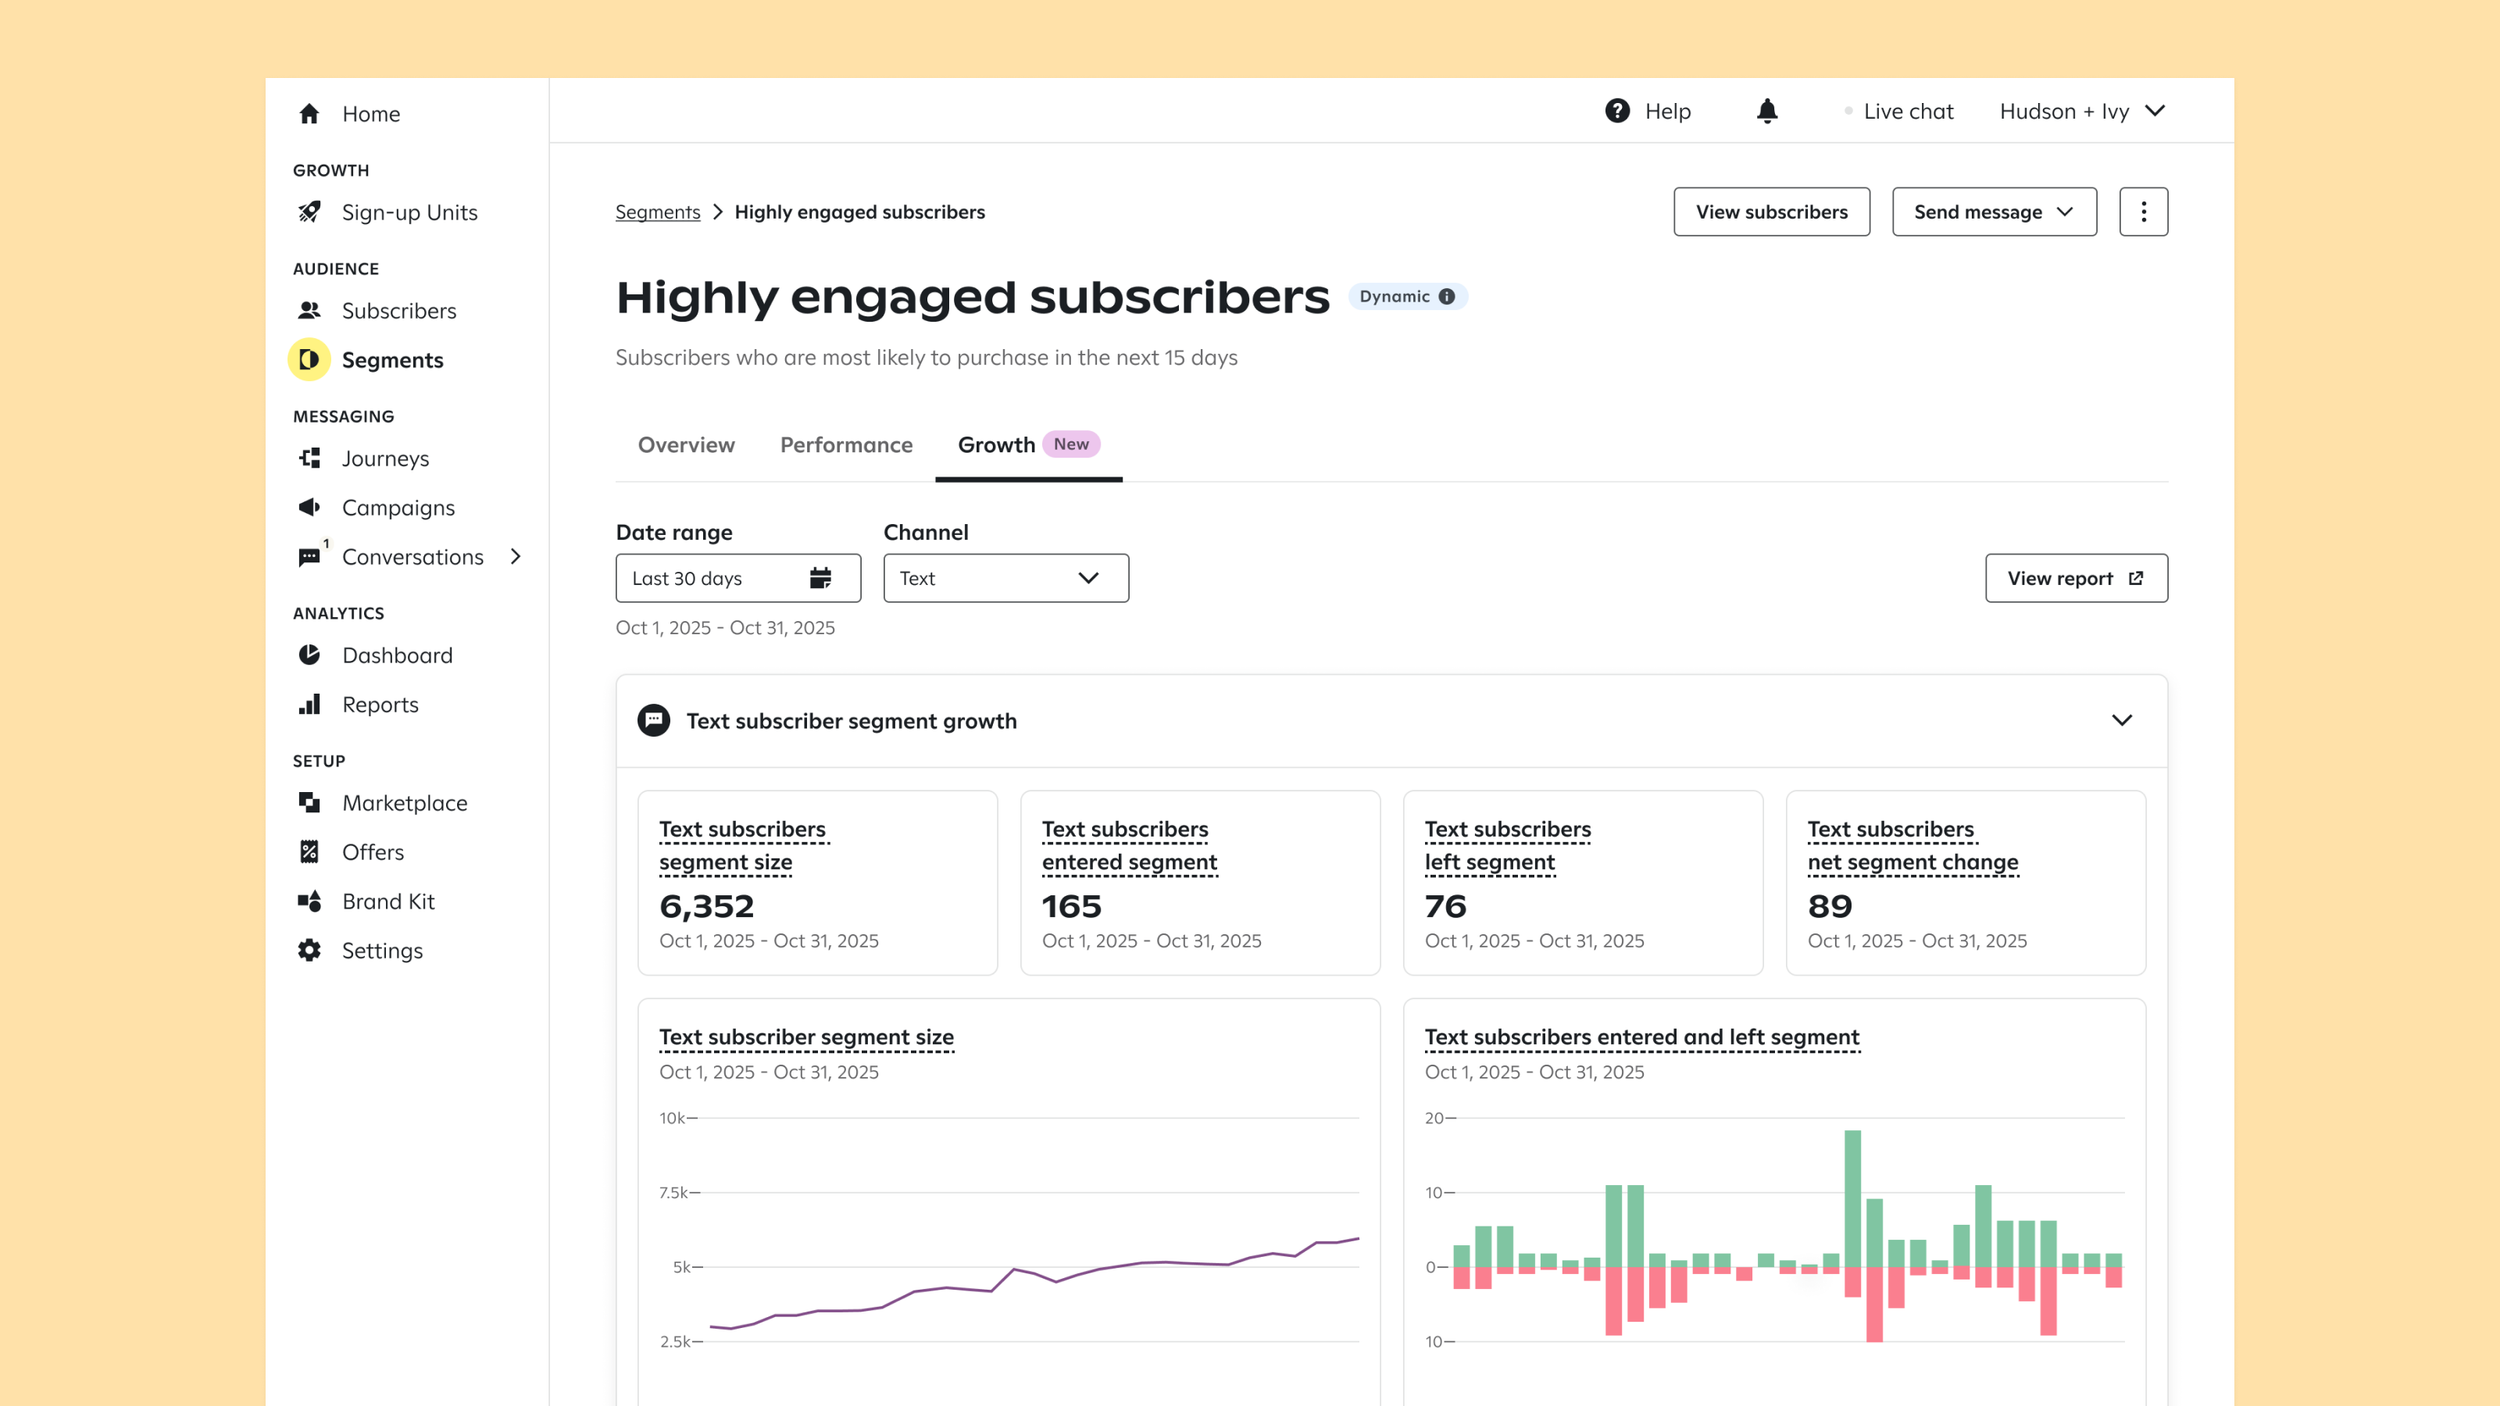
OverviewAttentive users had limited visibility into how their subscriber segments performed within Campaigns and Journeys. The platform lacked built-in reporting capabilities to surface segment-level insights, forcing users to manually export data and analyze it in third-party tools.
This fragmented workflow created inefficiencies and prevented teams from measuring program performance accurately.
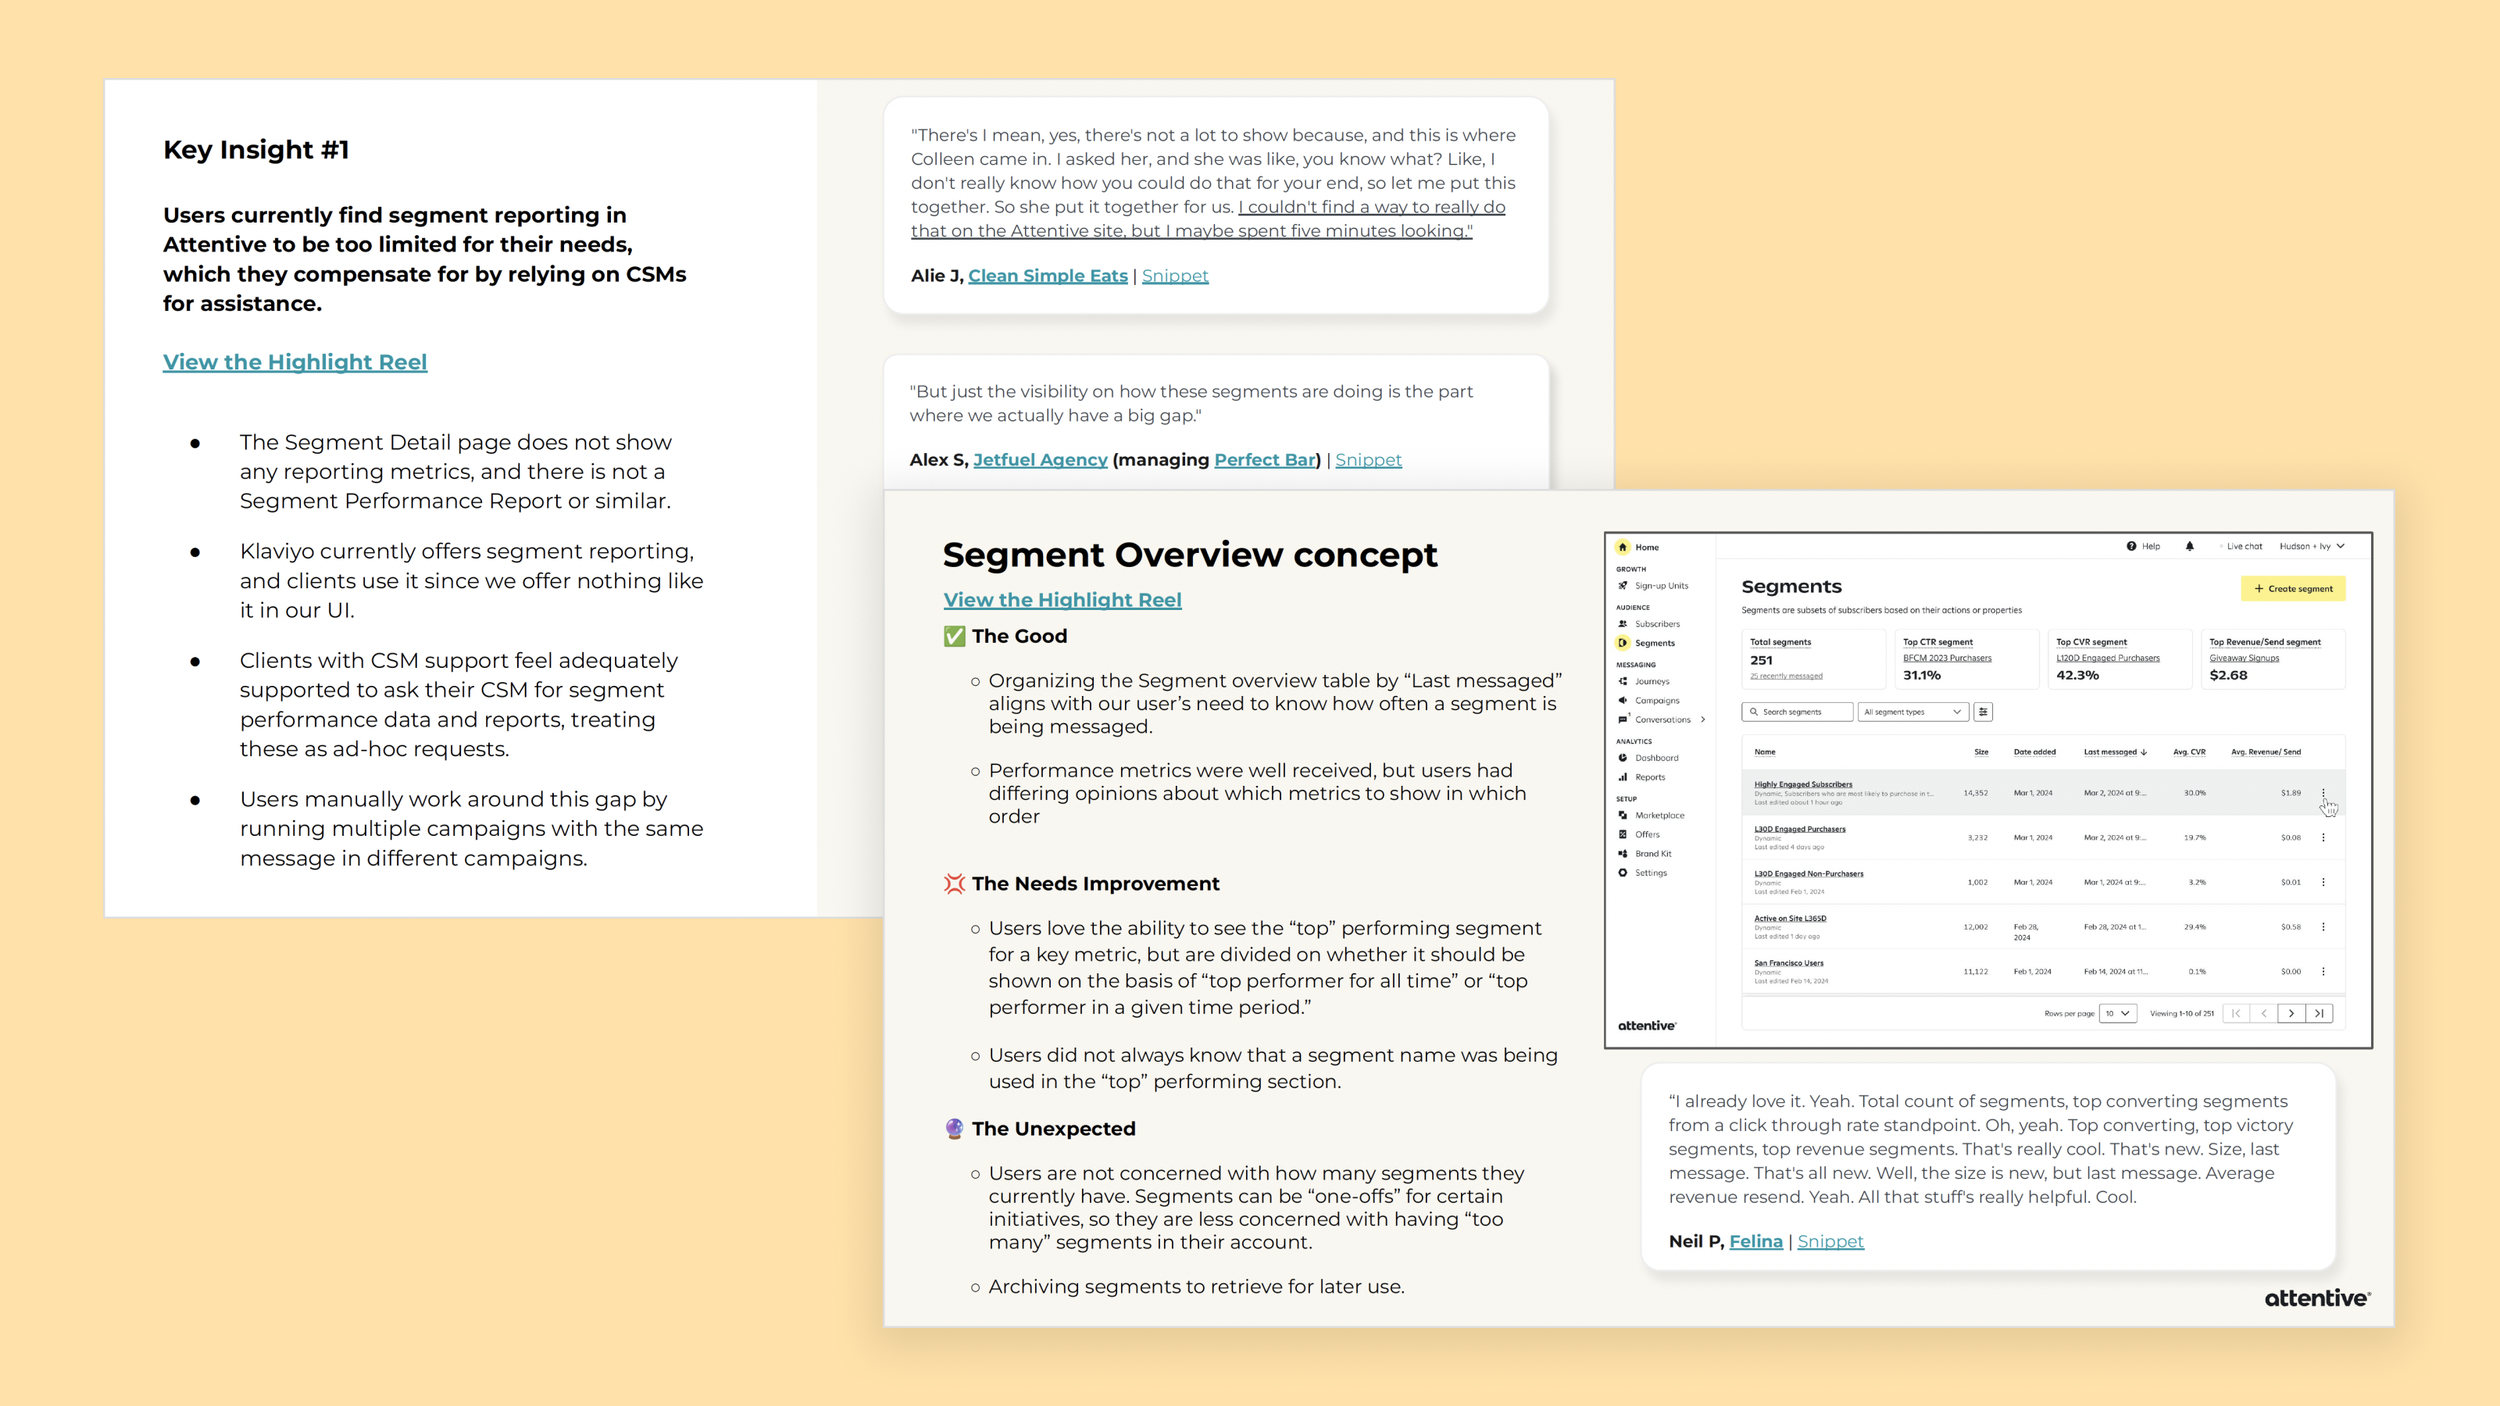
ProcessI conducted research sessions along with my PM and UXR counterparts with internal and external users to identify pain points, and reveal insights related to the importance of segment and subscriber reporting.
We discovered that users needed:
Granular performance visibility for each segment
The ability to track subscriber movement between segments
Tools to identify overlapping subscribers across multiple segments
Breaking these insights down into achievable milestones across multiple quarters, I designed, tested, and iterated on reporting enhancements across 3 key product surfaces: Campaign pages, Segment pages, and Reports.
ImpactThe top-requested feature, Campaign Performance by Segment, saw adoptions hit 1,700+ clients, making it the most quickly adopted product in Attentive’s history.
Our three highest tiers of clients set a record for reporting usage during the week of release- 77% of weekly active clients used a reporting feature, the highest ever recorded in Attentive’s history.
CSMs recorded overwhelmingly positive client sentiments and noticed beneficial changes in how strategies for marketing message improved once users could see real results in the segment data.
LearningsThere is never enough data that users desire- they will always want more!
My knowledge of data visualization design was deepened through concepts to convey movements of subscribers between segments and how to represent subscriber overlap in segments.
Custom Reports
January 2022 - December 2023
Initiative: ROC (Reduce Operational Cost)
OverviewBetween 2022 and 2023, Attentive faced significant inefficiencies within its legacy reporting system. The process for generating and exporting data was clunky, manual, and disconnected from the in-product experience. Users struggled with non-standardized metric definitions, limited customization options, and time-consuming workflows.
The Reduce Operational Cost (ROC) initiative was tasked at reducing Attentive’s yearly costs by eliminating these pain points for our users.
ProcessAs the lead designer for the Custom Reports initiative, I partnered with Product and Engineering to design an in-product self-service reporting experience that empowered users to filter, customize, save, and share their data seamlessly. No more laborious manual data outputs to get those insights!
We structured development into three actionable milestones, each building upon the last:
Foundational infrastructure: enabling data visibility and metric standardization.
Customizable report creation: introducing flexible filters, metrics, and interactive line charts for easy insights into trends over time.
Saved and shareable reports: allowing users to store and distribute tailored insights directly within the product.
Throughout the process, I collaborated closely with cross-functional stakeholders to align user needs with technical constraints, conducted iterative testing to refine usability, and ensured the interface supported scalability for future reporting enhancements.
ImpactThe impact was better than anticipated!
$2M+ in operational cost savings, exceeding company goals by 25%.
2× increase in overall reporting usage by Customer Success Managers (CSMs) from January to August 2023.
91 minutes saved per CSM per week after launch due to streamlined workflows.
67% reduction in reporting-related support tickets after metric standardization.
74% increase in visual report views and 349% increase in customized visual reports.
48% reduction in legacy report usage, marking a successful migration to the new platform.
LearningsThis was my first big project focused on solving the challenge of increasing operational efficiency at scale. This taught me how to balance design outcomes with business expectations.
I improved my user research skills by helping to conduct interviews, analyze copious amounts of quantitative and qualitative data, and format the findings into executive-level ready research read-outs.
I learned how important data consistency, access, and education are to empowering users to trust the data that they are seeing. Showing data is only one part of establishing trust in a reporting platform.

True things spoken by my Attentive comrades about me.
“Dom makes design decisions rooted in user needs while keeping business goals and engineering constraints in mind. She builds for the long term, not just the moment. She’s thoughtful in how she balances short-term feasibility with long-term clarity, often raising the right questions about what will truly serve the customer while aligning with our roadmap and platform priorities. Her work strengthens the product, improves the team, and empowers the users.”
— Nat Wongsavit, Staff Software Engineer
“This is like a “lifetime achievement” shoutout for Dom. Thanks for being an amazing design partner for the last 3+years on reporting. Dom has been a driving force for how we’ve significantly improved the reporting user experience. She is always thoughtful in ensuring we’re addressing user needs while balancing business considerations.
This year as we’ve spun up the EIR pillar, she has been pivotal in creating the guidelines and best practices for how Attentive as a company should build reporting in the product. As part of this effort, she’s also partnered directly with engineering to design how our reusable reporting components should work, letting our engineering teams build reporting more quickly.
Appreciate all your partnership as we worked together on improving reporting, but also for making our work fun and enjoyable. Definitely couldn’t have done this without you.”
— Don Le, Lead Product Manager
“Shoutout to Dom for championing the customer and defaulting to action! She has been absolutely critical to recent launches in EIR, including the redesigned analytics dashboard and self-serve attribution.
In just my first two months in EIR, I’ve been deeply impressed by how detail-oriented she is. I can always count on her to catch edge cases that slip past me. Dom also works at lightning speed. When a UI nuance came up on currency conversions, she came back the very next day with thoughtful options already mapped out. She takes excellent notes and brings strong product sense to every discussion. I rely on her as a partner on client feedback calls. I feel very lucky to work with her. Thank you, Dom!”
— Kristen Fang, Product Manager
“Dom, I am so happy to be working with you on BI Reporting! I appreciate how you build camaraderie on our team by keeping it fun with your positive attitude, candy rating FigJams, team mascots and custom emojiis! You do a great job of partnering with engineers to create awesome experiences for our users, answering our many questions, incorporating technical feedback into your designs, helping us to envision what the future of reporting design looks like in and working with us to ideate on the new reporting platform initiative. When I think about what great collaboration between design and engineering looks like,the answer is an easy one -Dom!”
— Amy Calliham, Engineering Manager